Real H₂ vehicle consumption: in-service data vs. tables
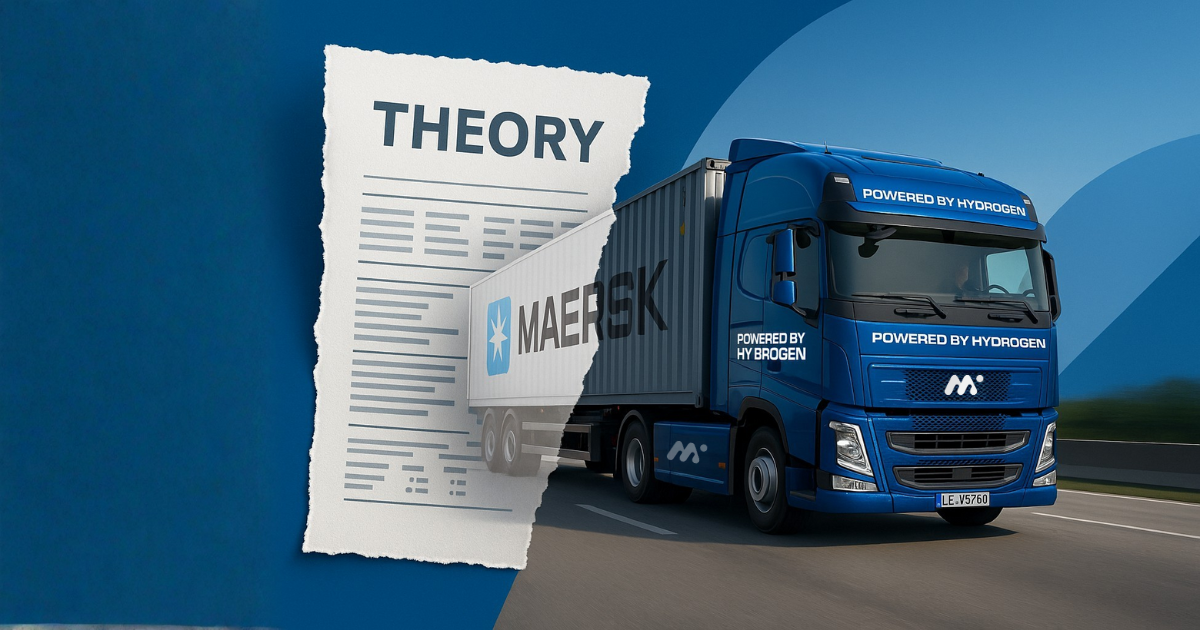
Paper vs. reality
Every fleet manager knows the difference. The numbers in the charts promise ideal fuel consumption, but it’s the actual kilometres that show what the vehicle can do in practice. It’s the same with hydrogen vehicles. The datasheet will provide an indicative framework, but only operation will show what variations need to be accounted for in fleet planning.
Testing of the Mobility & Innovation Production (MIP) hydrogen tractor in cooperation with METRANS has produced hard data – from trips with loaded containers, on hot summer days and on normal city and motorway routes.
What the datasheet says
Manufacturers report a typical consumption of 8-10 kg H₂/100 km for a hydrogen tractor. These values are based on standardised conditions: straight road, average load, steady speed. The datasheet is therefore an important starting point, but it does not reflect all the variables that a haulier will encounter in real operation.
What the operation with METRANS has shown
In June, the first phase of testing began. The tractor was running on routes between Dunajská Streda, Malacky and Bratislava, with loads from 7 to 19 tonnes. During the first two weeks alone, it covered approximately 1 500 km.
August brought even more challenging conditions – hot summer days, loads ranging from 11-21 tonnes and longer routes to Nitra.
Key Results:
- 6.9 kg H₂/100 km in pure hydrogen operation,
- 5.7 kg H₂/100 km when using battery charging.
These figures are among the segment’s record lows and showed that even under full load, the 600-750 km range is within the projected range.
Why the difference is important
The difference between datasheet and reality can be within ±20 %. For a small fleet this looks negligible, but for dozens of vehicles even a deviation of 0.5 kg/100 km can mean thousands of euros per year.
This is why real data becomes the basis for:
- 🔹 Precise journey planning,
- 🔹 TCO (Total Cost of Ownership) calculation,
- 🔹 infrastructure and investment decision-making.
How to work with it in practice
- Benchmark your fleet according to real routes – city routes, long-haul logistics, summer and winter season.
- Set up consumption monitoring – compare datasheet with reality.
- A pilot run is the safest way to get data before making a larger investment.
As a systems integrator, MIP helps clients plug this data directly into planning – from slots to fill, to schedules, to infrastructure projects.
A short example from the tests
With a loaded 21-tonne tractor unit, consumption was kept within the planned values and the range was sufficient even for longer routes. Fast filling meant that the driver was able to complete the filling during the mandatory break, so dispatching did not have to intervene in the turnarounds.
The result? Less risk and more certainty in operation – which is the most important thing for a fleet manager.
Conclusion
The datasheet will offer a number. Operation will offer reality. And it is real data that can be relied upon to make fleet decisions.
Testing with METRANS has shown that the MIP hydrogen tractor can handle demanding conditions while delivering consumption that is among the best in its class.
👉 Want to see what a pilot project would look like in your company? Contact us. We’ll prepare both a customized drive and an integration plan with real data – so that your emission-free fleet is up and running from the first mile.
❓ FAQ – Real consumption of H₂ vehicles
Question 1: Why don’t datasheet and real data often match?
Datasheet is based on standardized conditions – steady state speed, straight line, average load. However, in real operation, more factors affect consumption: load weight, route profile, weather or driving style. Therefore, real data is always more practical for fleet planning.
Question 2: How much can consumption vary in practice?
The difference between tabulated and actual consumption can be within ±20%. For a smaller fleet this is a minor variation, but for dozens of vehicles even a small variation can have a significant impact on costs and planning.
Question 3: What consumption did the MIP hydrogen tractor achieve during the tests?
In cooperation with METRANS, the tractor achieved the following values:
- 6.9 kg H₂/100 km in pure hydrogen operation,
- 5.7 kg H₂/100 km when using battery charging.
These results are among the best in the segment and confirm a reliable range of 600-750 km.
Question 4: How does real data help fleet managers?
Operational data allows for more accurate route planning, set delivery schedules and better TCO (Total Cost of Ownership) calculations. In addition, they serve as an argument in investment decisions and negotiations with partners.
Question 5: How can a carrier get its own data?
The most effective way is to run a pilot. As a systems integrator, MIP helps clients design, monitor and evaluate pilots so they have hard numbers before making larger investments.
Recommended reading
If you are interested in how hydrogen technology can be realistically used in logistics and fleet planning, we also recommend these articles:
- How to choose the right technology for your operation – an overview of the factors that determine the suitability of a drive for a particular type of transport.
- The zero-emission transport pilot project – what does the preparation, implementation and evaluation of a pilot deployment look like in practice.
- Hydrogen tractor: what to ask the supplier – key questions every haulier should know before investing in new technology.